Data You Already Have (And Aren’t Using Yet)
Published: May 29, 2025
Learning Objective: Help small business owners discover how to use existing, overlooked data in their business to make informed decisions.
Introduction
What if the insights you’re looking for are already in your inbox, spreadsheets, or your Instagram comments? Most small businesses are sitting on valuable data and don’t even realize it. Let’s identify possible sources for this data.
Common Sources of Untapped Data
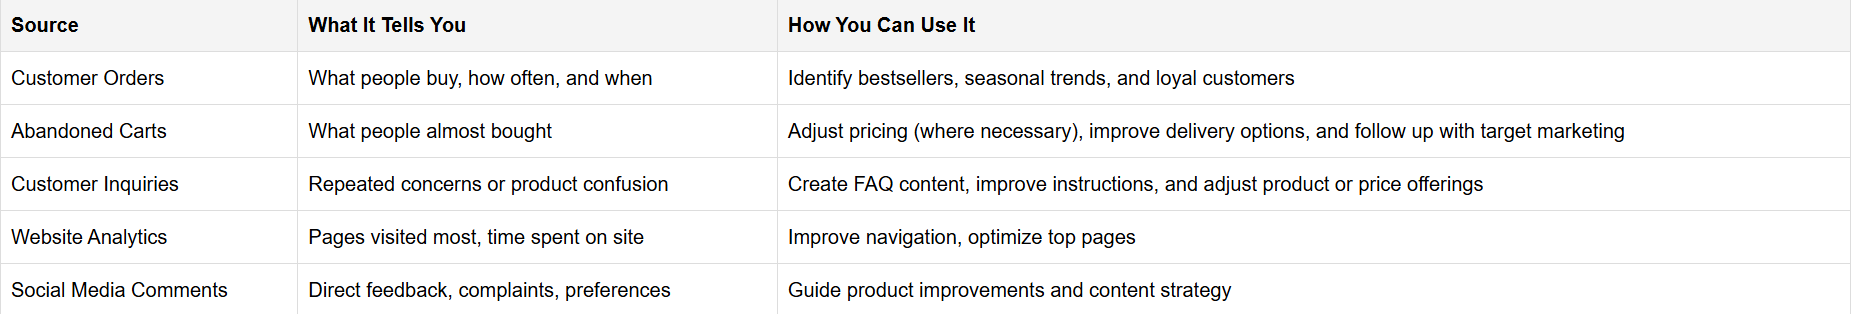
Why This Matters
Low-hanging fruit. No fancy tools needed. You already have the data.
Quick wins. Small changes can lead to noticeable results.
Customer clarity. You learn what your customers really care about and work towards it.
How to Start Using It
Collect inventory on your sources: Where are you already collecting data? (e.g., sales receipts, customer chats, DMs)
Start with one: Start small with one dataset (e.g., order history). Find out how many orders were placed last month, top-selling products, least ordered product.
Question the data: What can this data tell me? Data storytelling is awesome!
Track trends: Use a spreadsheet to log recurring themes weekly for a month.
Visualize insights: Use bar charts, line graphs, or even sticky notes on your wall, whatever helps you see the pattern.
Management decision: Based on the insights you’ve seen, how can you make it better for the customer? Improve your sales and marketing efforts? Develop new products?
Case Study: Muna’s Skincare Business
Muna owns a homemade skincare brand. She noticed she was constantly answering questions like: “Which of your products work best for oily skin?”
At first, she answered each message manually. Eventually, she started tracking the trends and recording each question into a spreadsheet. After two weeks, a pattern emerged. She discovered that 60% of her inquiries were about oily skin.
Here’s what she did with the information:
She grouped the questions into categories (oily skin, dry skin, acne treatment, etc.)
She created a landing page each group, “Oily Skin Essentials” for easy navigation by clients.
She featured her top 3 products in that category, with a detailed explanation on how to use each product.
The Outcome:
Sales from the products increased by 25% in 14 days
There were fewer repetitive questions in her inbox
She now launches new bundles based on FAQ trends
In Summary
“You don’t need new software, just awareness of how to maximize what you have. From receipts to reviews, your business is already generating data. Start listening, tracking, and testing, one insight at a time.”
Need help understanding your data? Let’s talk!