Types of Data: Demystifying Numbers, Categories & Time
Published on: May 23, 2025
“Not All Data Is Created Equal”.
Does the word “Data” have you feeling a certain kind of way? If yes, then this should help!
Many small business owners hear the word “data” and imagine messy spreadsheets or complicated software. They see a spreadsheet and think, “No way I’m doing this!” The good news is, there’s no reason to fret. Understanding what kind of data you're working with is the first step to making it useful, and hopefully exciting.
In this post, we’ll break down the data types into simple, clear buckets, using examples from real small businesses.
1. Structured vs. Unstructured Data
Structured Data – This is clean, organized, and usually lives in tables, think Excel sheets or databases.
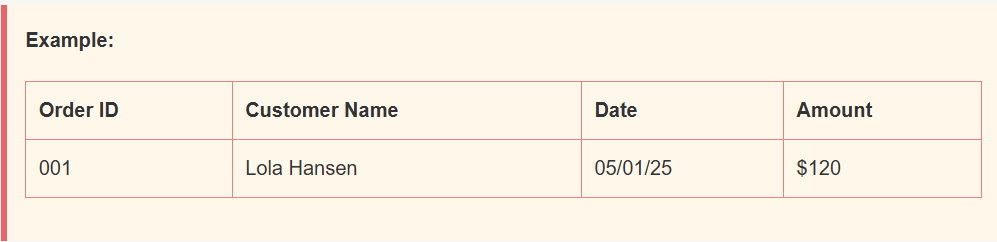
For your business, it could be sales records, inventory lists, or customer details.
Unstructured Data – This is messier and doesn’t fit neatly into rows and columns. It could include customer feedback, social media posts, images, and videos.
2. Numerical vs. Categorical Data
Numerical Data – This is data you can count or measure. Great for totals, trends, and averages like total sales or stock inventory.
Categorical Data – This describes labels or groups, like food categories (Drinks, Dessert), customer type (New, Returning), or payment method.
3. Time-Based (Temporal) Data
Temporal data shows how things change over time. Examples include booking dates, purchase times, or monthly performance. This is often overlooked but holds major insight for business patterns.
Wrap-Up: Know Your Data to Use Your Data
Ask better questions
Spot patterns faster
Build smarter reports or dashboards
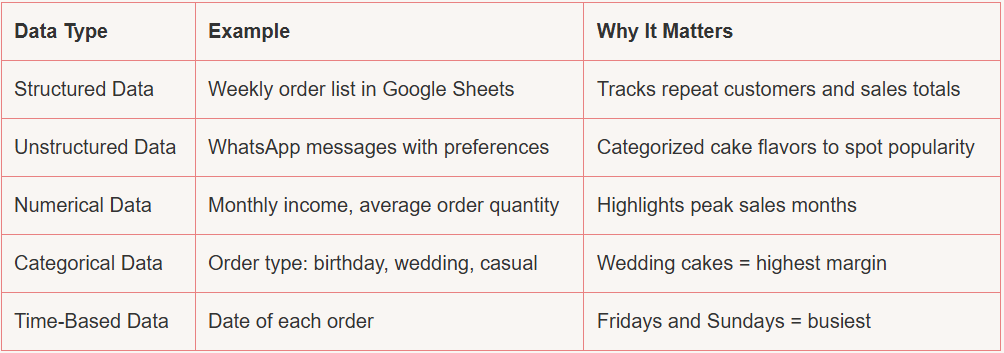
Mini Case Study: Tolu’s Home Bakery
Tolu runs a growing home-based bakery in Cedar Rapids. She uses Instagram to post her cakes, takes orders via WhatsApp, and records her monthly income in a notebook.
She wants to know:
Which cake brings in the most income?
What days of the week are busiest?
When is it slow enough to teach online?
Result: Tolu launched a “Friday Cake Rush” discount and saw a 17% revenue increase in 4 weeks.
“Every small business already has data. Knowing how to classify and read it makes all the difference.”
Need help understanding your data? Let’s talk!