Practical Steps to Building a Dashboard
In the last post, we explored how small businesses can use a Decision Support System (DSS) to turn raw data into better business decisions. Today, we will break down how to build a dashboard that makes the most important parts of your business visible at a glance.
What Is a Dashboard?
A dashboard is a visual display of your most important business data, all in one place. Think of it as the business’s control panel. With a dashboard, there’s no need to keep digging through spreadsheets to know the business performance within a certain period- the most important aspects of your business are visible at a glance.
A good dashboard helps you:
Track performance over time
Spot trends before they become problems
Identify issues early enough to act
Make faster decisions with confidence
The Biggest Dashboard Mistakes Small Businesses Make
Most small business owners build dashboards that look impressive but provide very little clarity. Sometimes, this could be because they try to:
Track too many metrics at once- Information overload prevents you from making quick decisions
Use too many charts and visual elements- This creates noise
Focus on impressive looks rather than what decisions it supports- Every visual must support a decision
This results in a dashboard that is overwhelming and incapable of providing any form of support to the business decision making process. Sadly, this defeats the whole purpose of building a dashboard.
“A good dashboard answers one important question:
What is my business trying to tell me? ”
Every chart, number, and visual must point towards a decision you are willing to take. For example, if your goal is to improve profitability, your dashboard should focus on revenue, costs, profit margins, top-performing products, and customer retention. Every other thing is irrelevant.
A practical dashboard structure for small businesses
Once you've identified the business questions you want answered, the next step is organizing your dashboard so those answers are easy to find. Here is a four-section structure that works for most small businesses, regardless of what you sell.
1. KPI Summary Section
This section gives a quick overview of business performance. It is usually the first section you see when you open a dashboard. It gives a complete picture of your entire business. Keep it simple at 4 or 5 core numbers. Include metrics such as total revenue, total profit, total orders, and average profit margin.
2. Product Performance Section
This section highlights what is working and what needs fixing. Some useful metrics to include in this section are revenue by product, profit by product, and units sold by product. More often than not, business owners are surprised by the insights they get from this section.
3. Customer Insights Section
Customers are the engine of any business, so this section helps you understand customer behavior- what do your customers value most? How often do they return? What marketing strategies are actually converting? For this section, you can track metrics such as repeat purchase rate, customer retention, best-selling categories, and website conversions.
4. Decision Insights Section
Most dashboards skip this one, yet it is the most important section. It translates data into recommended steps for action. For example: Aloe Vera Mist sells frequently but generates very low profit. What should you do? It tells you what deserves attention, what needs improvement, and what action should come next.
This transforms your dashboard from a reporting tool into a decision-making tool. Let's look at this example.
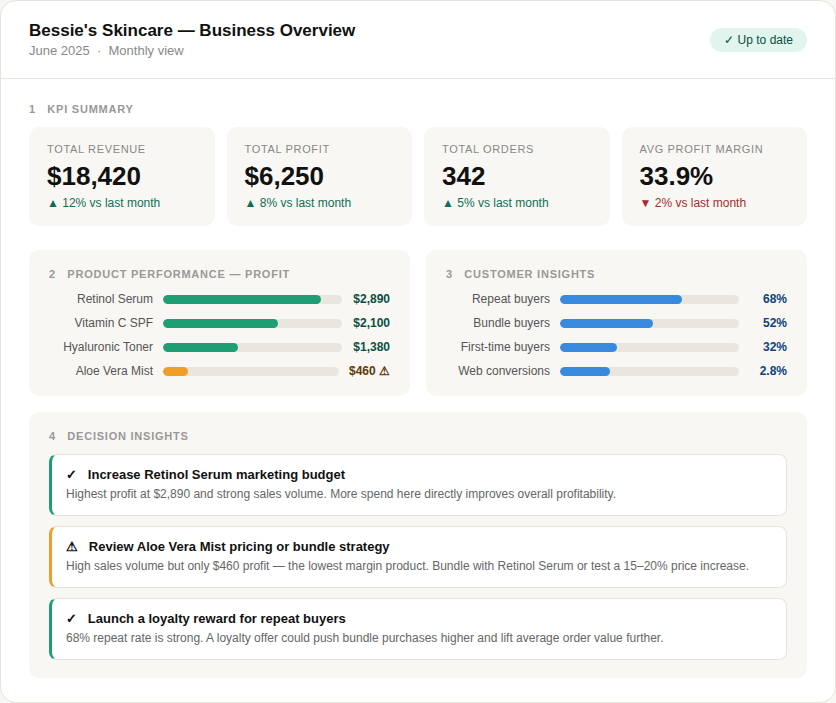
The decision insight section at the bottom tells you what to do next, and why. This is the difference between a reporting tool, and a decision-support tool.
“With the dashboard, decision-making was no longer from the gut, but backed by data.”
The OIA Framework
Before building a dashboard, consider the following:
The Observation: What does the data show?
You must be specific. For example- Aloe Vera Mist sold 142 units but made $ 460 in profit.
The Implication: Why does it matter?
Stating the implication gives the observation weight. For example- Our most popular product barely contributes to the bottom line.
The recommended Action: What should we do?
Take a concrete step. For example - Bundle Aloe Vera Mist with the Retinol Serum and test whether customer will accept a $7 increase in price.
“Start with your three biggest surprises from the data to create your decision insights.”
Practical example: Bessie’s Skincare Dashboard
Bessie’s dashboard revealed the highest performing product is Retinol Night Serum. Although Aloe Vera Mist sold the most units, it generated the lowest profit margin. She also discovered that repeat customers spent more on bundled products.
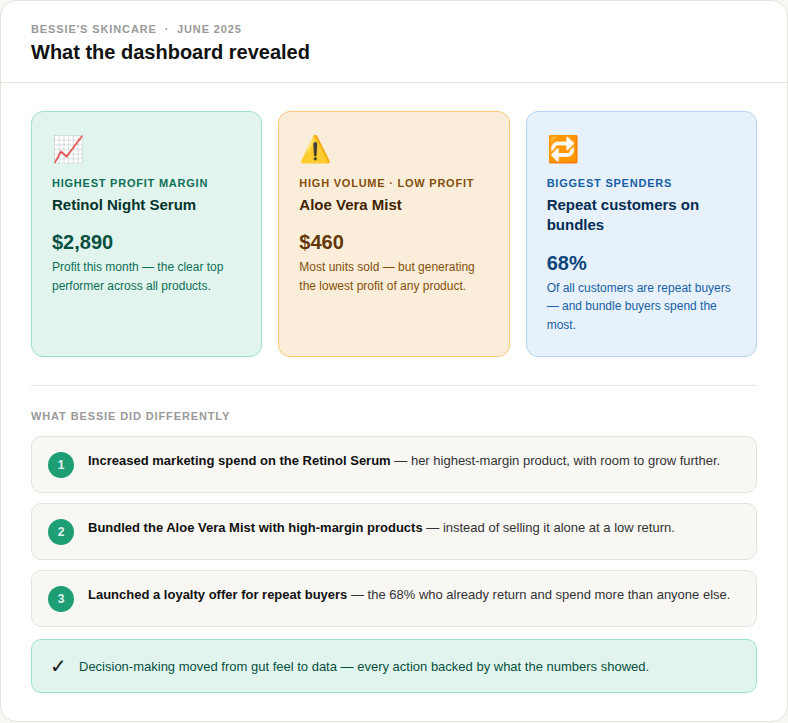
Based on this information, Bessie stopped relying on assumptions. She decided to increase marketing spend on high-margin products, bundle lower-margin products with best sellers to raise average order value, and introduced loyalty offers to improve retention among repeat customers.
Before you build ask these three questions:
Great dashboards are built backwards. Start with the decision you need to make, then work backwards to determine the data, metrics, and visuals required to support that decision.
Ask the following:
What do I need to see?
Why do I need to see it? (what decision does it inform?)
What will I do differently based on what it shows?
If any metric fails to answer these three questions, then it doesn't deserve a section on the dashboard.
“A dashboard is only as valuable as the decisions it drives. Start making data-driven decisions to improve profitability and optimize your operations.”
Tools You Need To Build A Simple Dashboard
You don’t need expensive software or tools to build a dashboard. Using any of these tools, you can create a clear and functional dashboard for your business:
Excel- it is offline, widely used.
Google Sheets- Free and collaborative.
Looker Studio- Free tool by Google that connects to sheets and Google Analytics. Some learning is required.
Power BI - Create powerful visuals. Some learning is required
Tableau Public- Free version available for powerful visuals. Some learning is required.
If you have never built a dashboard before, start with Excel or Google Sheets. Practice working with the 4 sections highlighted, using real data to get insights. With time, you will need more analytical tools to analyze your data.
“The goal is not complexity, but clarity. ”
Summary
Dashboards are not only for large corporations. Small and medium businesses also need clear, smart and timely information. Good dashboards help tell the story behind your business, at a glance.
Start small, with one goal- build 4 sections. Decide on the metrics that connect to your biggest business goal. Start building the dashboard, one section at a time. Make sure that every metric points you towards an action.
You already have a great story- tell it well. Build a dashboard that helps you see that story clearly. A good dashboard should help you understand what is happening, why it is happening, and what to do next.
Up Next
In the next post, we’ll explore how small businesses can use AI and automation without breaking the bank. We’ll cover:
Affordable AI tools
Automation opportunities that save the most time
Practical ways to improve efficiency
Common mistakes to avoid when adopting AI